
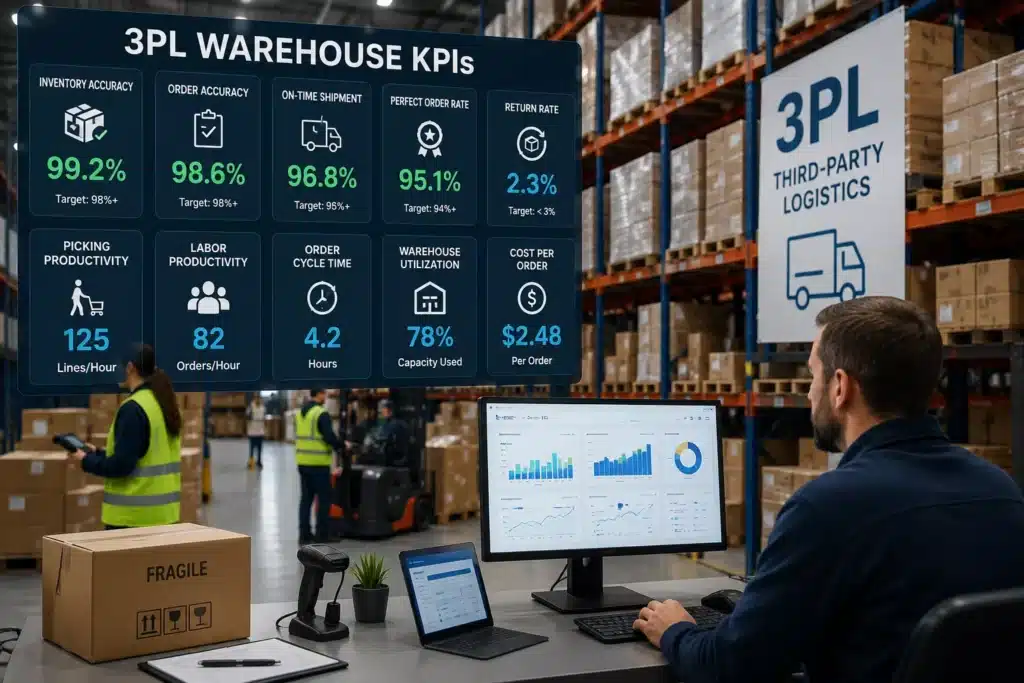


Warehouse performance can look healthy on the surface while hidden inefficiencies continue to increase operating costs.
Orders may be shipping on time, but labor costs could be rising. Inventory may appear accurate, while misplaced stock is slowing down picking. Storage capacity may be filling up, even though some clients have slow-moving inventory occupying valuable space.
This is why warehouse operators need more than basic order and inventory reports.
The right 3PL warehouse KPIs provide a measurable view of operational performance, helping managers identify bottlenecks, control costs, improve service levels, and make better capacity decisions.
In this guide, we’ll cover 20 warehouse KPIs worth tracking, including the formulas, why each metric matters, and what the numbers can tell you about your operation.
What Are 3PL Warehouse KPIs?
3PL warehouse KPIs are measurable indicators used to evaluate the efficiency, accuracy, cost, and service quality of a warehouse operation serving multiple clients.
Unlike a simple warehouse report, a useful KPI framework connects individual activities to broader business outcomes.
For example:
Slow picking → longer order cycle times → delayed shipments → lower client satisfaction
Or:
Poor inventory accuracy → picking errors → returns and reshipments → higher fulfillment costs
Looking at these relationships is more valuable than monitoring individual numbers in isolation.
1. Inventory Accuracy
Inventory accuracy measures the percentage of inventory records that correctly match the physical stock available in the warehouse.
Formula:
Inventory Accuracy = (Accurate Inventory Records ÷ Total Inventory Records) × 100
Inventory discrepancies can lead to stockouts, incorrect orders, unnecessary cycle counts, and client disputes.
For a multi-client operation, it is useful to analyze accuracy by:
- Client
- SKU
- Location
- Warehouse
- Inventory type
A consistently declining accuracy rate may indicate problems in receiving, putaway, picking, returns, or inventory adjustments.
2. Order Accuracy Rate
Order accuracy measures the percentage of orders fulfilled without an error.
Formula:
Order Accuracy Rate = (Error-Free Orders ÷ Total Orders) × 100
Errors can include:
- Wrong SKU
- Incorrect quantity
- Missing product
- Incorrect packaging
- Shipping to the wrong destination
A high order volume can make even a small error percentage expensive.
For example, a 1% error rate across 50,000 monthly orders represents approximately 500 problematic orders.
This is why order accuracy should be monitored alongside total order volume.
3. On-Time Shipment Rate
On-time shipment rate measures how consistently orders leave the facility within the required shipping window.
Formula:
On-Time Shipment Rate = (Orders Shipped on Time ÷ Total Orders) × 100
This KPI is particularly useful for identifying operational delays before they become client complaints.
A declining rate may be caused by:
- Picking bottlenecks
- Packing delays
- Poor order prioritization
- Staffing shortages
- Late order release
- Carrier cutoff issues
Tracking the metric by client, shift, carrier, or order type can make the underlying problem easier to identify.
4. Order Cycle Time
Order cycle time measures the time between an order entering the fulfillment workflow and being shipped.
A typical cycle includes:
Order Release → Pick → Pack → Stage → Ship
The exact target depends on the operation and service-level agreement.
Rather than trying to achieve the lowest possible number, operators should look for consistent processing times and unusual delays.
For example, if average cycle time increases significantly during afternoon shifts, the issue may be staffing, order batching, or workflow design rather than overall warehouse capacity.
5. Picking Accuracy
Picking accuracy measures whether warehouse employees select the correct items and quantities.
Formula:
Picking Accuracy = (Correct Picks ÷ Total Picks) × 100
Poor picking accuracy can increase:
- Returns
- Reshipments
- Customer service workload
- Labor costs
- Shipping expenses
When accuracy falls, investigate location organization, product identification, replenishment, employee training, and scanning procedures before simply adding more labor.
6. Picking Productivity
Picking productivity measures how much picking work is completed during a specific period.
Common measurements include:
- Units per labor hour
- Lines per labor hour
- Orders per labor hour
The best measurement depends on the warehouse’s order profile.
A warehouse processing large multi-line orders should not necessarily use the same productivity benchmark as an operation handling single-item ecommerce orders.
For this reason, productivity should be evaluated alongside order complexity.
7. Labor Productivity
Labor productivity measures the amount of warehouse output generated from available labor hours.
A simple calculation is:
Labor Productivity = Total Units or Orders Processed ÷ Labor Hours
This metric helps managers understand whether additional labor is actually improving throughput.
If labor hours increase while order volume remains relatively stable, it may indicate:
- Inefficient workflows
- Excessive travel time
- Poor slotting
- Manual data entry
- Rework
- Training issues
The objective isn’t simply to reduce labor. It is to get more productive output from the resources already available.
8. Receiving Cycle Time
Receiving cycle time measures how long it takes to process inbound inventory.
The process may include:
Arrival → Unload → Count → Inspect → Receive → Put Away
Long receiving times can delay inventory availability and create congestion around receiving areas.
Tracking this metric by supplier, client, shipment type, or shift can help identify recurring inbound problems.
9. Dock-to-Stock Time
Dock-to-stock time measures the time between an inbound shipment arriving and the inventory becoming available in its storage location.
This is different from receiving cycle time because it focuses specifically on when inventory becomes usable.
A long dock-to-stock time can mean inventory is technically received but still unavailable for fulfillment.
Reducing unnecessary delays between receiving and putaway can improve inventory availability without increasing storage capacity.
10. Putaway Accuracy
Putaway accuracy measures whether received inventory is stored in the correct location.
Incorrect placement creates problems later in the fulfillment process.
Employees may spend additional time searching for inventory, while system records may show that stock exists even though it cannot be located quickly.
Putaway accuracy should therefore be evaluated together with inventory accuracy and picking productivity.
11. Warehouse Space Utilization
Space utilization measures how effectively available warehouse capacity is being used.
Formula:
Space Utilization = Used Storage Capacity ÷ Available Storage Capacity × 100
Higher utilization isn’t automatically better.
When storage areas become overcrowded, operators may experience:
- Longer travel distances
- Blocked locations
- Poor accessibility
- Increased handling
- Reduced picking efficiency
The goal is to optimize capacity while preserving efficient movement through the facility.
12. Inventory Turnover
Inventory turnover measures how frequently inventory moves through the warehouse over a defined period.
For a 3PL, turnover can reveal which products require frequent replenishment and which products remain in storage for extended periods.
Analyzing turnover at the SKU and client level can help with:
- Slotting
- Storage planning
- Capacity forecasting
- Slow-moving inventory identification
Low turnover doesn’t necessarily mean poor performance. Some clients naturally maintain long-term inventory. The important question is whether storage requirements are understood and priced appropriately.
13. Storage Utilization by Client
Facility-level space utilization isn’t enough for a multi-client operation.
Warehouse managers should also understand how much capacity each account consumes.
Useful measurements include:
- Pallets stored
- Bin locations occupied
- Cubic volume
- Average inventory
- Peak inventory
- Days in storage
This information is valuable for both capacity planning and client billing.
It can also reveal accounts that consume significantly more warehouse resources than expected.
14. Return Rate
Return rate measures the percentage of shipped orders that are subsequently returned.
Formula:
Return Rate = Returned Orders ÷ Total Shipped Orders × 100
A return isn’t automatically a warehouse failure.
Returns can result from:
- Customer preference
- Product quality
- Incorrect product selection
- Shipping damage
- Picking mistakes
- Incorrect quantities
For meaningful analysis, separate warehouse-related returns from returns caused by the product or end customer.
15. Perfect Order Rate
Perfect order rate provides a broader view of fulfillment quality.
A perfect order typically meets multiple requirements, such as:
- Correct item
- Correct quantity
- Correct documentation
- On-time shipment
- Damage-free fulfillment
This KPI is useful because a warehouse can have high picking accuracy while still experiencing shipping or documentation problems.
Perfect order rate brings multiple quality requirements together.
16. Cost Per Order
Cost per order measures the average fulfillment cost associated with each order.
Formula:
Cost Per Order = Total Fulfillment Costs ÷ Total Orders Fulfilled
Depending on the accounting model, costs may include:
- Direct labor
- Packaging
- Equipment
- Facility costs
- Technology
- Handling
This metric becomes particularly useful when comparing clients with different order volumes and fulfillment requirements.
A client generating more orders isn’t necessarily more profitable if each order requires significantly more resources.
17. Cost Per Order Line
Cost per order can hide differences in order complexity.
Consider two orders:
Order A: 1 product line
Order B: 15 product lines
Both count as one order, but they may require very different amounts of labor.
Cost per order line provides another way to measure fulfillment efficiency.
Formula:
Cost Per Order Line = Fulfillment Costs ÷ Total Order Lines
Using both metrics provides a better picture of operational complexity.
18. Inventory Shrinkage
Inventory shrinkage measures inventory that is missing or otherwise unaccounted for.
Potential causes include:
- Receiving discrepancies
- Mis-picks
- Misplaced inventory
- Damage
- Theft
- Incorrect adjustments
- Data-entry errors
For a client-based warehouse, shrinkage has financial and relationship implications because the inventory belongs to another business.
Tracking shrinkage over time can help identify recurring process weaknesses.
19. Billing Accuracy
Billing accuracy measures whether warehouse services are correctly captured and charged.
Depending on the agreement, billable activities can include:
- Receiving
- Storage
- Picking
- Packing
- Returns
- Special handling
- Value-added services
- Inventory management
This KPI is particularly important because operational errors can become revenue leakage.
For example, if a value-added service is performed but never recorded, the warehouse absorbs the labor cost without collecting the associated revenue.
A connected warehouse management system can help reduce the gap between work performed and services billed.
20. Client Profitability
Revenue is only one part of account performance.
Client profitability looks at the relationship between account revenue and the resources required to service that account.
A simplified calculation is:
Client Profitability = Client Revenue − Client-Related Operating Costs
Consider:
- Storage requirements
- Labor
- Receiving volume
- Order complexity
- Returns
- Special handling
- Value-added services
Two clients with identical revenue can have very different profit margins.
Understanding this difference can help operators make better decisions about pricing, contracts, warehouse capacity, and service levels.
Which 3PL Warehouse KPIs Should You Track First?
You don’t need to monitor all 20 metrics immediately.
A practical starting dashboard could include:
Inventory
- Inventory accuracy
- Shrinkage
- Putaway accuracy
Fulfillment
- Order accuracy
- Picking accuracy
- Order cycle time
- On-time shipment rate
Productivity
- Picking productivity
- Labor productivity
- Receiving cycle time
Capacity
- Space utilization
- Storage utilization by client
- Inventory turnover
Financial Performance
- Cost per order
- Billing accuracy
- Client profitability
Once these metrics are established, additional KPIs can be added based on the specific requirements of the operation.
How a WMS Makes KPI Tracking Easier
The challenge isn’t knowing which KPIs exist.
The challenge is getting accurate, timely data to calculate them.
When receiving, inventory, picking, fulfillment, and billing information are stored across separate spreadsheets or systems, KPI reporting becomes more difficult.
A warehouse management system brings these operational processes together.
With centralized warehouse data, operators can analyze:
- Inventory movements
- Warehouse locations
- Order activity
- Picking performance
- Receiving activity
- Fulfillment workflows
- Storage requirements
- Client activity
- Billable services
This creates a more complete view of warehouse performance.
For a multi-client operation, that visibility becomes even more important because performance needs to be understood not only at the warehouse level, but also by client, SKU, workflow, and service type.
Using WizeFulfill to Improve 3PL Operational Visibility
WizeFulfill is a warehouse management system built around the operational requirements of 3PL businesses.
The platform brings core warehouse processes into a centralized system, helping operators manage inventory, inbound operations, fulfillment workflows, client requirements, and invoicing.
Key capabilities include:
- Unified Dashboard & Visibility
- Smart Inbound & Inventory Management
- Fast Order Fulfillment
- Configurable Workflows & Automation
- Mobile Barcode Scanning
- Scalable System Setup
- Contracts & Invoicing
- Multi-client warehouse management
This centralized approach makes it easier to connect operational activity with performance measurement.
For example, inventory activity can support inventory accuracy analysis, fulfillment workflows can provide data for order and picking performance, and recorded warehouse services can support more accurate client billing.
The result is not simply more reports.
It is better visibility into where warehouse resources are being used, where processes are slowing down, and where improvements can have the greatest business impact.
How to Turn Warehouse KPIs Into Action
A KPI is only useful when it leads to a decision.
If picking productivity falls, investigate the cause.
If inventory accuracy declines, identify where discrepancies are entering the process.
If cost per order increases, determine whether order complexity, labor, packaging, or workflow changes are responsible.
If one client consumes significantly more resources than another, review the account’s pricing and service requirements.
The objective should be to create a continuous improvement cycle:
Measure → Identify → Investigate → Improve → Measure Again
This approach turns warehouse data into an operational management tool rather than a collection of monthly reports.
Final Thoughts
The best-performing warehouses don’t focus on a single number.
They look at how accuracy, productivity, fulfillment speed, capacity, cost, and profitability influence one another.
The 20 KPIs covered in this guide provide a practical framework for evaluating warehouse performance:
- Inventory Accuracy
- Order Accuracy Rate
- On-Time Shipment Rate
- Order Cycle Time
- Picking Accuracy
- Picking Productivity
- Labor Productivity
- Receiving Cycle Time
- Dock-to-Stock Time
- Putaway Accuracy
- Warehouse Space Utilization
- Inventory Turnover
- Storage Utilization by Client
- Return Rate
- Perfect Order Rate
- Cost Per Order
- Cost Per Order Line
- Inventory Shrinkage
- Billing Accuracy
- Client Profitability
The goal isn’t to collect the largest possible amount of data.
It’s to identify the metrics that reveal where your warehouse is performing well, where resources are being wasted, and where operational improvements can have the greatest impact.
As warehouse operations become more complex, centralized WMS data can make that process significantly easier.
WizeFulfill helps 3PL operators bring inventory, fulfillment, warehouse workflows, and client operations together in one system.
Want better visibility into your warehouse performance? Book a WizeFulfill demo to see how a purpose-built 3PL WMS can support your operation.